 Skip to content

How to Monitor Engine Data on a J1939 Display
Table of Contents
Monitoring engine data on a J1939 display is not just about connecting a screen to the CAN bus. To make the display truly useful, you need to know where the data comes from, which values matter most, and how to organize them so operators can read them quickly.
What a J1939 Display Reads From the CAN Bus
A J1939 display reads engine-related data broadcast by the engine control module, or ECM, over the CAN bus. This data is structured through PGNs and SPNs, which define what the parameter is and how it should be interpreted. In other words, the display does not create engine data. It reads, decodes, and presents values already being sent on the network.
This is also why supported parameters matter. A value will only appear if the ECU is broadcasting it, the display supports it, and the screen is configured to show it.
Which Engine Data Should Be Shown First on a J1939 Display
The first screen should not show the most values. It should show the most useful values.
In most cases, the main page should focus on four core parameters:
- engine speed
- coolant temperature
- oil pressure
- battery or system voltage
These give the operator a fast view of basic engine condition. Secondary pages can then include engine hours, engine load, fuel-related values, or other machine-specific parameters. This is usually more practical than crowding too much information onto the home screen.
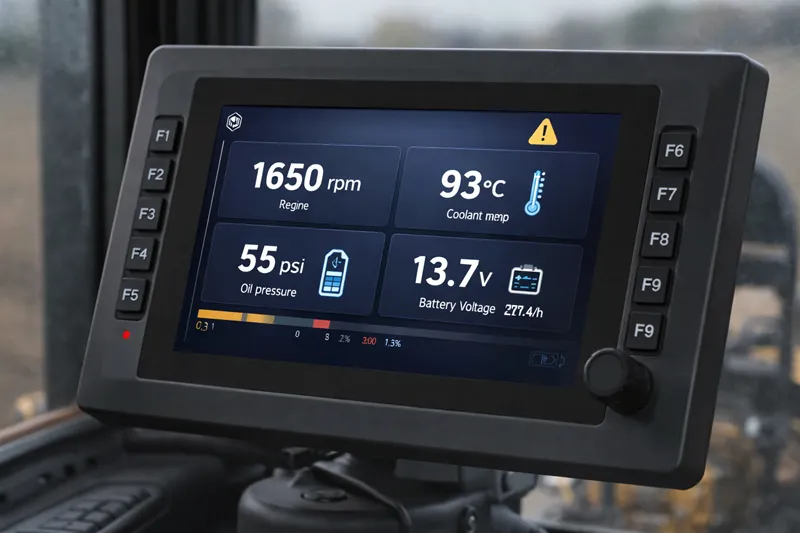
How to Set Up 1-Up, 4-Up, and Custom Display Pages
A 4-up page is often the best choice for the main engine monitoring screen because it allows several critical values to stay visible at the same time. A 1-up page is more useful when one value needs extra attention during testing or troubleshooting.
Automatic scan can help cycle through secondary values, but it is less suitable for critical parameters that should always remain visible. Custom pages are often the most practical option because they let users build layouts around real operating needs instead of relying only on default screens.
How to Monitor Active Fault Messages Alongside Live Engine Data
Live engine values and active fault messages should not be treated the same way. Engine speed, oil pressure, and coolant temperature are continuous operating values. Fault messages are exception-based alerts that need to stand out immediately.
A better setup is to keep live engine data on the main operating page and use a separate fault or warning page for active issues. At the same time, warning icons or fault indicators should remain visible enough that the operator can quickly tell when deeper attention is needed.
Why Some J1939 Engine Data Does Not Appear on the Display
One of the most common problems is that a parameter does not show up on the screen. In most cases, there are three likely reasons:
- The engine ECU is not broadcasting that parameter.
- The display does not support that PGN or SPN.
- The parameter is supported, but it has not been added to the page layout.
A practical troubleshooting order is simple: first confirm the ECU is transmitting the value, then confirm the display supports it, and finally confirm the page is configured to show it.
Best Practices for Building a Practical J1939 Engine Monitoring Screen
A useful J1939 engine monitoring setup should be built around operator use, not just parameter availability. The first screen should stay clear and easy to read. Secondary pages should hold supporting information. Fault pages should be easy to access when something goes wrong.
In practice, the most effective setup is usually divided into three levels:
- a core engine health page
- a secondary runtime or performance page
- a fault or warning page
This makes the display easier to use in real working conditions, where quick recognition is more important than showing every available value at once.
Conclusion
To monitor engine data effectively on a J1939 display, the goal is not to show every parameter. The goal is to show the right parameters in the right order.
A practical setup starts with core engine values such as engine speed, coolant temperature, oil pressure, and system voltage, then adds secondary pages and fault visibility as needed. The most useful J1939 display is the one that helps operators understand engine condition quickly and identify whether missing data is caused by the ECU, the display, or the page layout.