 Skip to content

Displaying J1939 Data on CAN Bus Displays for Mobile Machinery
Table of Contents
In mobile machinery, a CAN bus display is far more than a visualization device.It is the primary human–machine interface responsible for transforming SAE J1939 network data into actionable, real-time information for operators.
While J1939 standardizes how ECUs broadcast data over CAN, the real engineering challenge lies in how this data is interpreted, scheduled, and rendered on the display—especially in machines with multiple ECUs, dense message traffic, and harsh operating conditions.
This article examines how J1939 data is displayed on CAN bus displays from a practical engineering perspective, focusing on UI design, performance trade-offs, and system-level considerations relevant to OEM engineers and system integrators.
Need guidance on J1939 visualization and CAN bus display integration for your machine platform?
Discuss your system requirements and HMI architecture with our engineering team.
What Makes J1939 Data Visualization Different on CAN Bus Displays?
SAE J1939 organizes vehicle and machine communication around broadcast messages, rather than point-to-point signals.
For a CAN bus display, this creates a set of challenges distinct from basic CAN communication.
Key characteristics include:
Data is structured as PGNs (Parameter Group Numbers) containing multiple parameters
Individual measurements are defined as SPNs (Suspect Parameter Numbers)
Multiple ECUs transmit data simultaneously on the same network
Update rates vary widely depending on function and priority
As a result, a CAN bus display must do more than receive messages—it must interpret protocol-level data and present it in a stable, human-readable form.
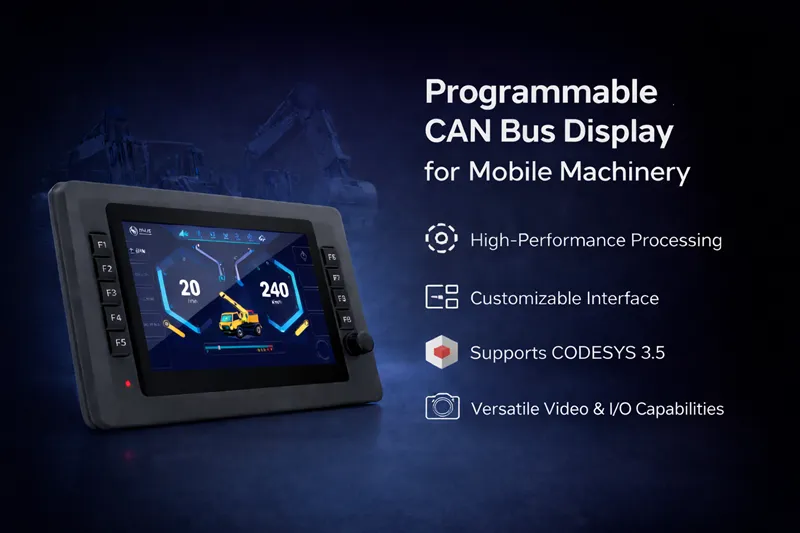
Mapping J1939 PGNs and SPNs to Industrial HMI Widgets
A CAN bus display never shows raw CAN frames.
Instead, J1939 protocol elements are translated into industrial HMI widgets such as gauges, numeric fields, status indicators, and alarms.
Typical mapping logic includes:
PGN → functional data group (e.g. engine, transmission, diagnostics)
SPN → individual parameter (RPM, speed, temperature, pressure)
Scaling and offset rules → engineering units displayed to the operator
In real-world applications, commonly visualized J1939 parameters include:
Engine speed (RPM)
Vehicle or machine speed
Coolant temperature
Oil pressure
Fuel level
Odometer values
Diagnostic messages (DM1)
The accuracy and stability of this mapping directly affect operator trust.
Poorly implemented mappings can lead to flickering values, unstable gauges, or misleading alarms—even when CAN communication itself is functioning correctly.
Refresh Rate vs. Readability — A Core UI Trade-Off
One of the most common design mistakes in CAN bus displays is updating the UI at the same rate as incoming J1939 messages.
Although some J1939 parameters may update every 10–20 ms, refreshing the screen at this rate can:
Increase CPU load on the display
Cause visible jitter in gauges and numeric fields
Reduce readability under vibration and motion
Effective CAN bus displays decouple CAN message reception from UI rendering by:
Buffering incoming J1939 data
Applying smoothing or update-rate limiting
Refreshing the UI at human-oriented rates (typically 30–60 fps)
This decoupling preserves data integrity while improving visual stability and operator comfort.
Handling Multi-ECU J1939 Data on a Single Display
Modern mobile machines often include multiple ECUs, such as:
Engine control units
Transmission controllers
Hydraulic control systems
Body or auxiliary controllers
A CAN bus display must manage concurrent J1939 data streams without compromising UI responsiveness.
Key design considerations include:
Filtering and prioritizing relevant PGNs
Preventing CPU load spikes during peak network traffic
Maintaining consistent screen layouts across machine states
Some display applications implement flexible mechanisms—such as menu-based configuration or learning modes—to adapt to different ECU combinations.
A “Teaching Mode,” for example, can dynamically identify active ECUs and supported PGNs, allowing the display to adapt to different machine variants without extensive reconfiguration.
In certain architectures, programmable CAN bus displays also handle local I/O signals for basic interaction or status feedback. When synchronized properly with J1939 data, the display can function as both a visualization interface and a localized interaction node within the overall system.
Latency Perception in J1939-Based Displays
Operators may not think in milliseconds, but they immediately notice delayed or inconsistent responses.
In CAN bus displays, perceived latency can originate from:
UI rendering cycles
Data buffering strategies
Video decoding and overlay processing
In high-load scenarios—such as visualizing dense J1939 traffic while rendering multiple camera streams—display-side processing capability becomes a critical factor.
Modern displays using multi-core application processors can handle:
J1939 message parsing
UI rendering
Multi-channel video decoding
in parallel execution paths.
This parallelism helps ensure smooth UI behavior and responsive instrumentation even under heavy system load.
Factory: clean, stable 24V
Mobile: 8–32V range, load dumps, spikes, ripple → requires automotive-grade electronics
Designing Operator-Focused J1939 Screens
Effective J1939 visualization is not about exposing every available SPN.
Instead, the goal is to present clear, actionable information.
Well-designed CAN bus display interfaces typically:
Group related parameters logically
Limit on-screen data density
Use visual hierarchy to guide operator attention
For system integrators, the development environment behind this logic is equally important.
When implemented using platforms such as CODESYS 3.5, J1939 PGN and SPN mappings can be managed through structured application logic and reusable function blocks, reducing the need for low-level coding and simplifying long-term maintenance across OEM programs.
The Role of CAN Bus Displays in Long-Term OEM Programs
In long-term OEM machine platforms, the CAN bus display often becomes a standardized interface reused across multiple models.
By focusing on:
Flexible J1939 data mapping
Scalable UI layouts
Predictable refresh behavior
OEMs can adapt a single display platform to different ECU configurations while minimizing software rework and lifecycle support costs.
Conclusion
Displaying J1939 data on CAN bus displays is not a simple communication task—it is a system-level UI and performance challenge.
Successful implementations balance protocol interpretation, real-time data handling, and operator-focused interface design.
For OEM engineers and system integrators, understanding how J1939 data behaves at the display level is essential when selecting and integrating CAN bus displays into mobile machinery.